A&M FlowAgency / sales
Ami, the assistant that qualifies our own leads
2Channels, one assistant
24/7Answering, nights included
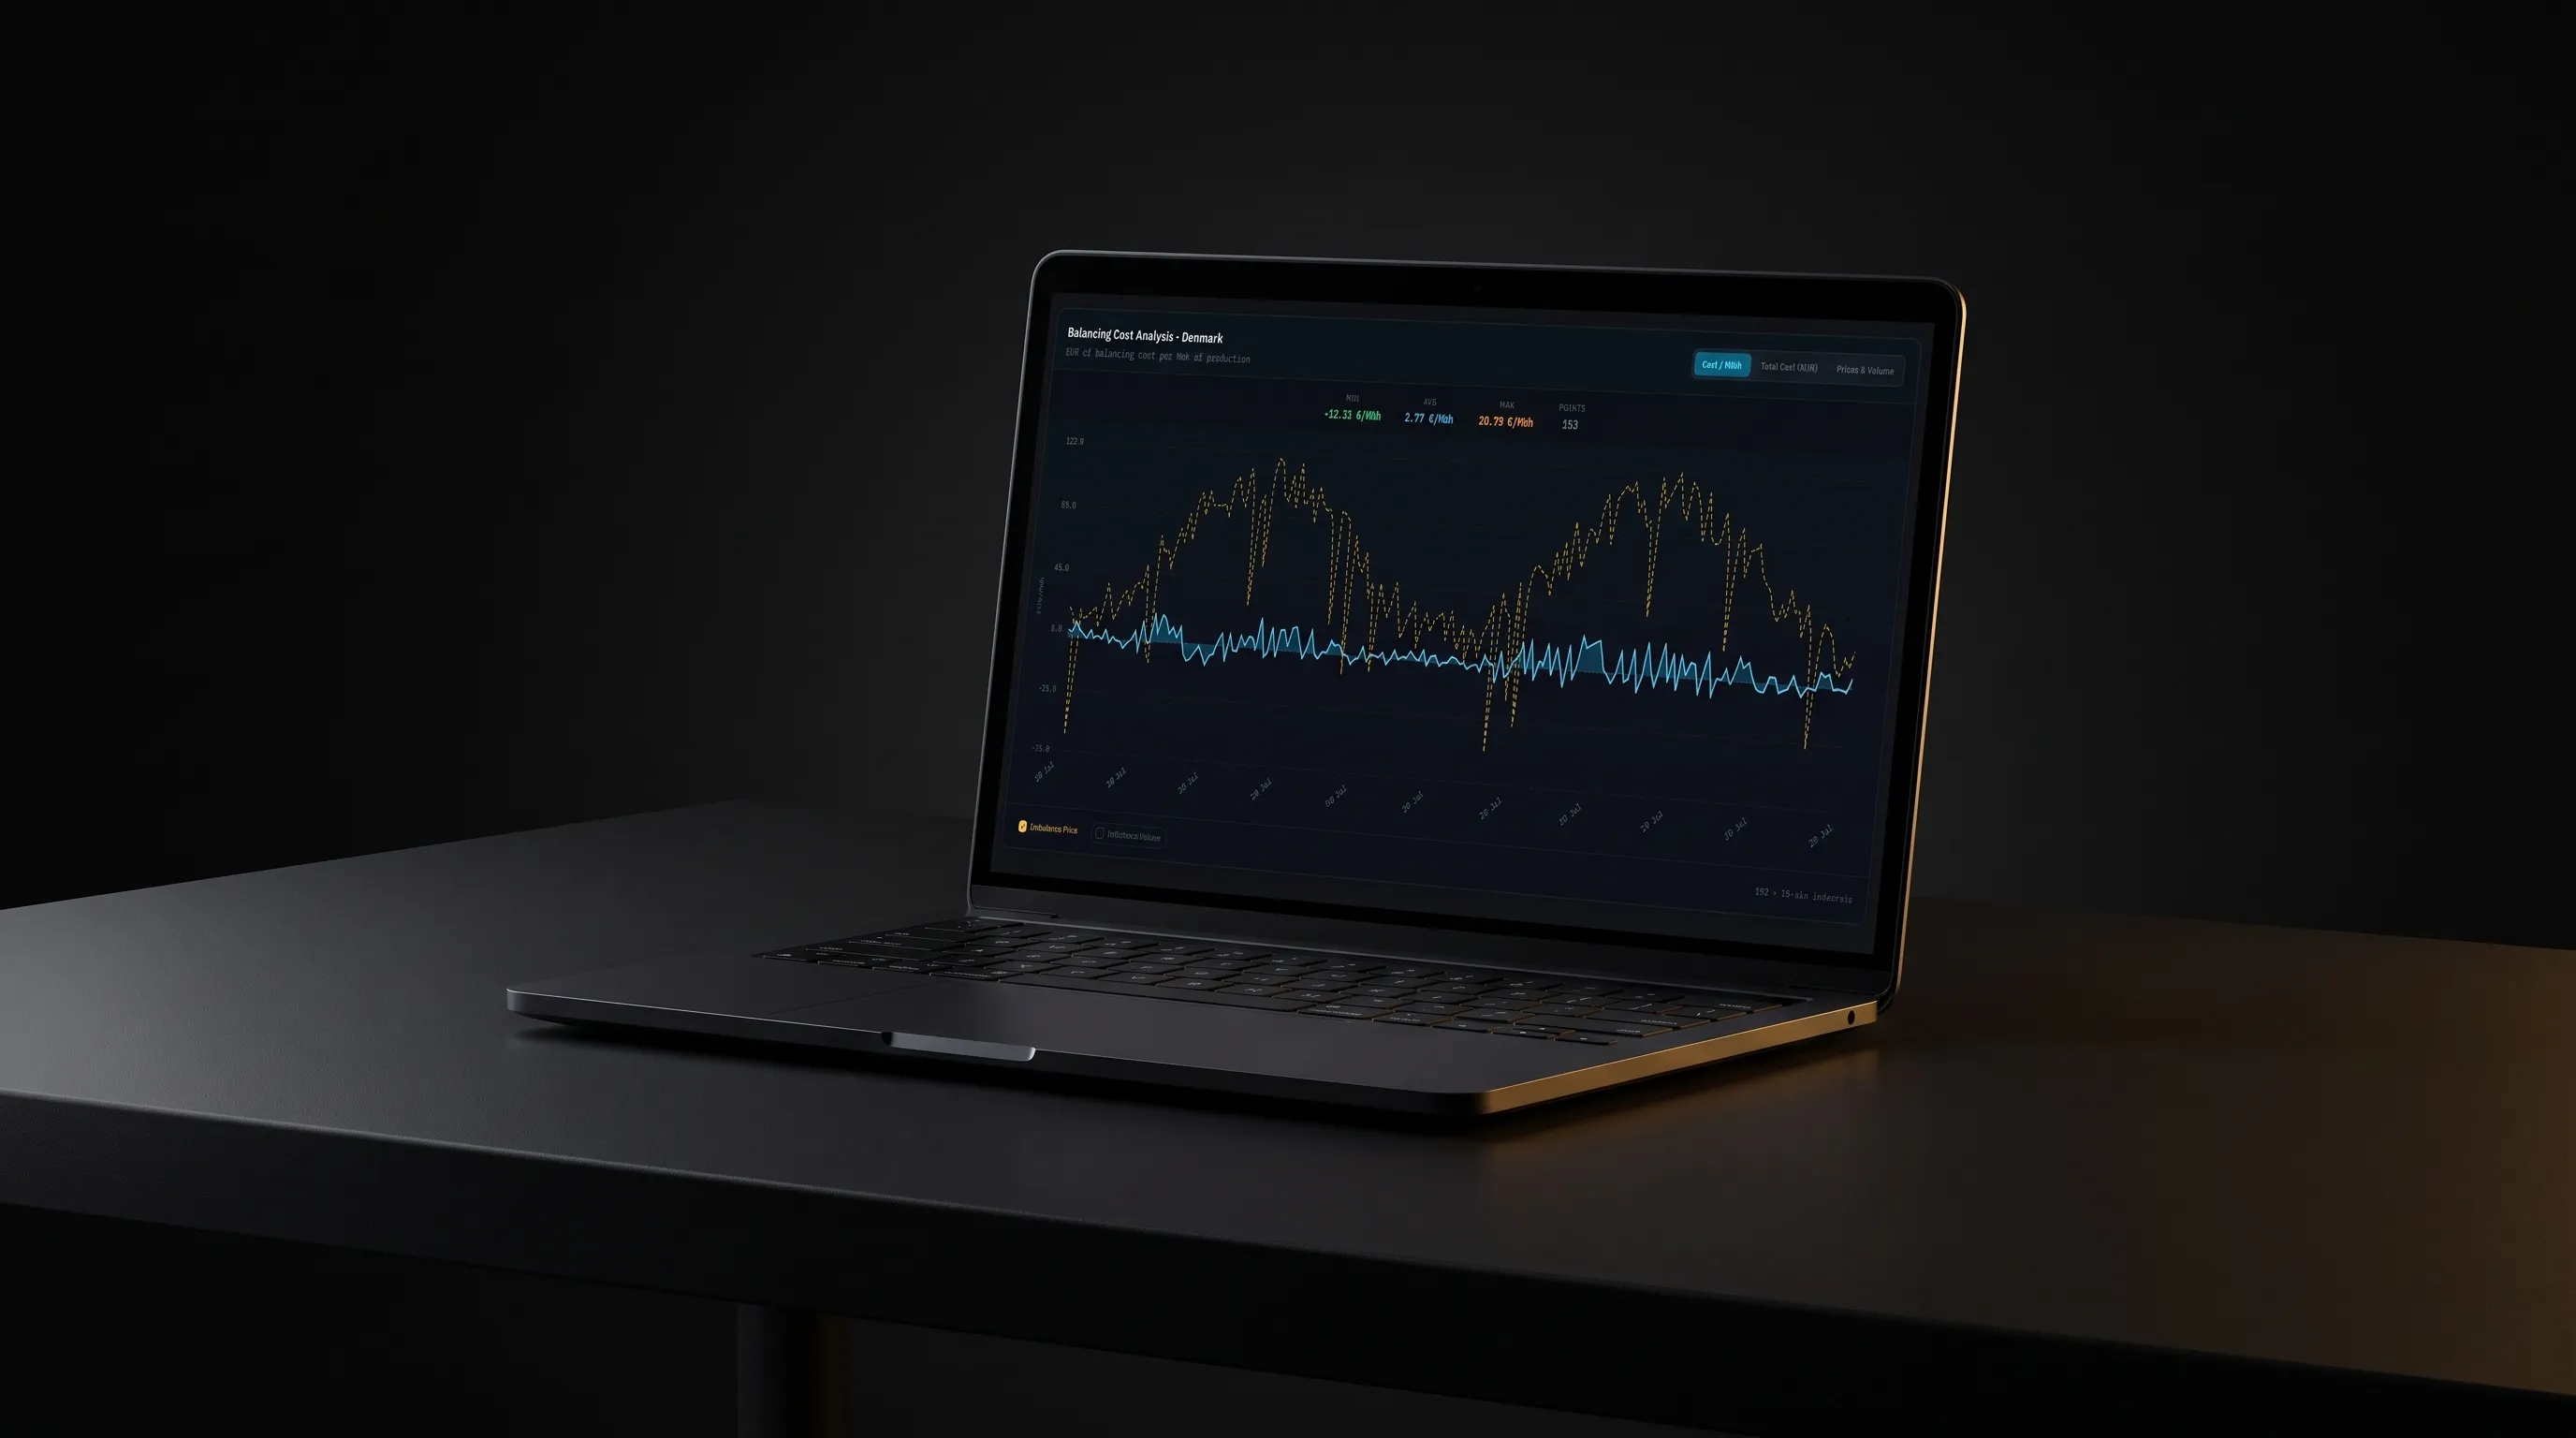
Drop in a forecast-versus-actual export and the tool pulls Denmark's imbalance price from Energinet for exactly that period, then returns total cost, produced volume and average cost per MWh, with the file parsed in your browser and uploaded nowhere.
Built with Claude Code in 1 day
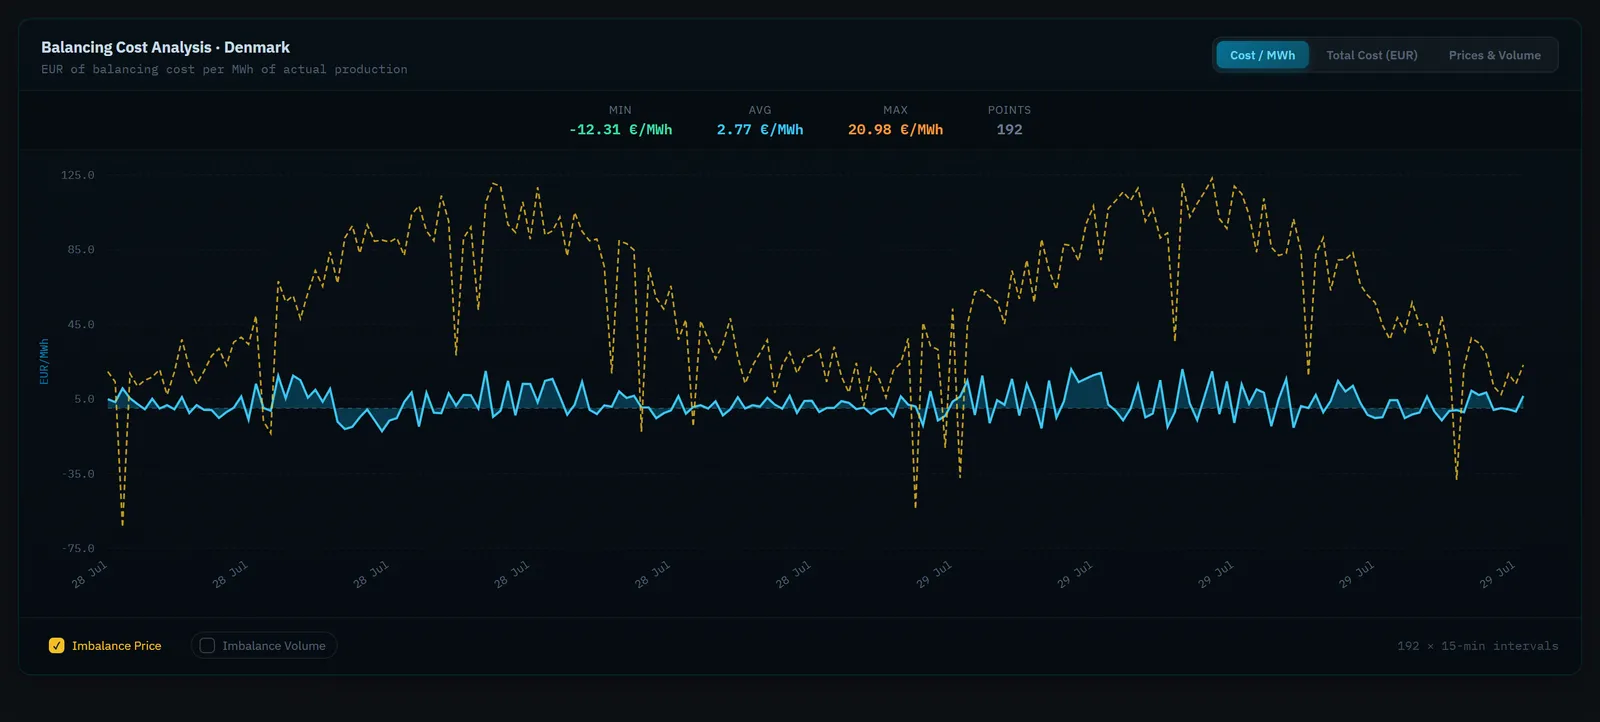
Balancing cost per MWh of real production runs against the Energinet imbalance price for the same window. Two days read as 192 quarter-hours, 2.77 €/MWh on average and 20.98 at the worst.
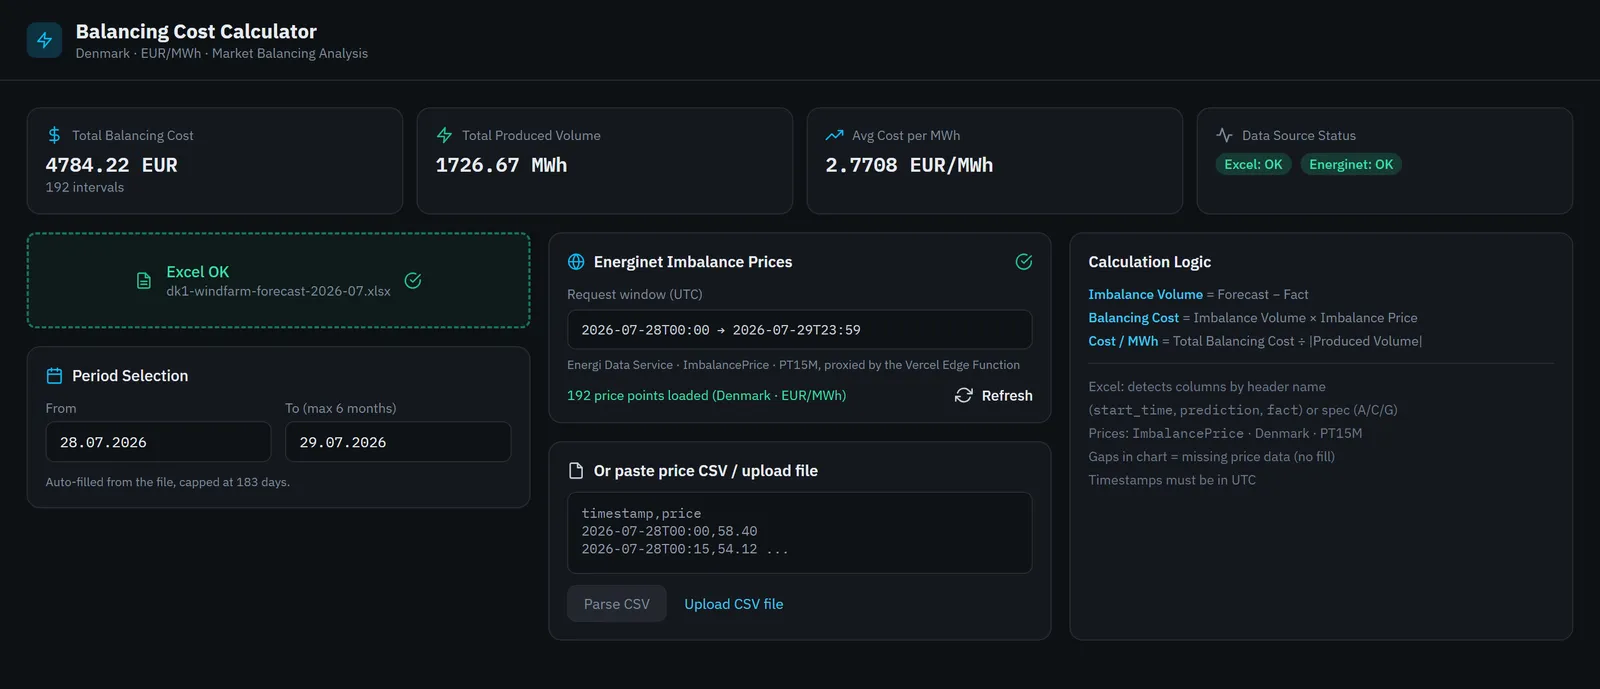
Columns are found by header name, the period fills itself in from the file and Energinet prices are pulled for exactly that window. Total cost, produced volume and average cost per MWh come back on the same screen.
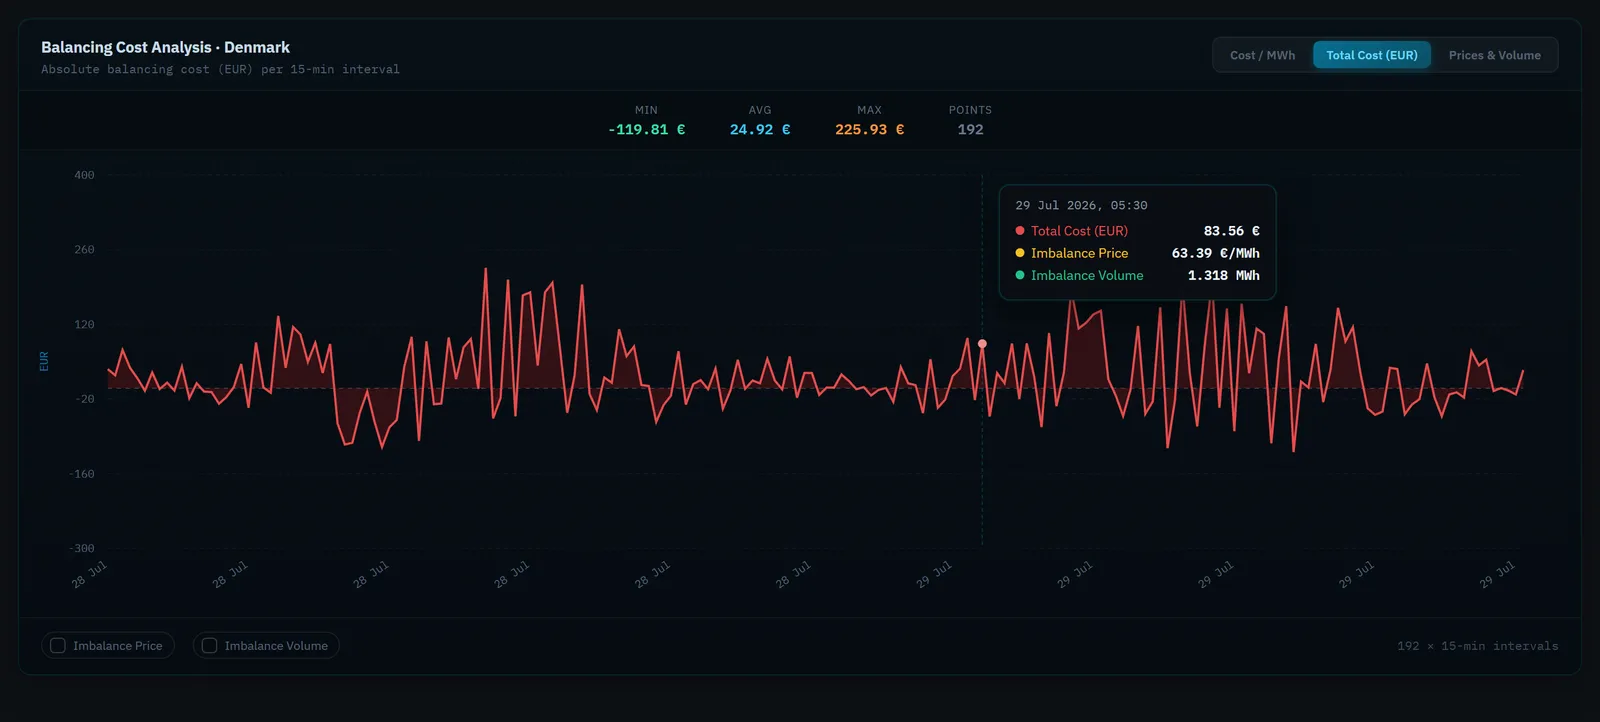
Absolute cost per 15-minute interval shows where one bad forecast hour turned into real money, up to 225.93 € in a single quarter-hour here. Hover any point for its cost, price and imbalance volume.
The forecast export sat in one file and the price table in another, joined by hand every time.
One upload returns total cost, volume and cost per MWh across every 15-minute interval.
01Context
Denmark settles renewable output against a forecast at 15-minute resolution: any shortfall or surplus is bought or sold back at the market's imbalance price. A producer usually has that price in one place and its own forecast-versus-actual numbers in another, with no easy way to see what a bad forecasting day actually cost.
02What we built
Drop in an Excel or CSV export with a timestamp, forecast and fact column; the app finds the right columns by header name, or by a fixed layout when headers are missing, and detects the covered period automatically. A file up to 50 MB parses entirely in the browser, nothing is uploaded anywhere. The period auto-fills from the file, capped at six months, and the app fetches Denmark's imbalance price for that window from the Energinet Energi Data Service.
03How it works
React, TypeScript and Vite on the front end, Recharts for the chart, the xlsx library for parsing. Imbalance volume is forecast minus fact; balancing cost is imbalance volume times the imbalance price; cost per MWh is total cost divided by total produced volume. An interval with no matching price is excluded from the totals rather than interpolated. The Energinet Energi Data Service blocks direct browser requests, so a Vercel Edge Function proxies the price call in production.
ANM SOLUTIONS / CONTACT US
First 30-minute call is free. We scope it, you decide.
Related service · Workflow & Process Automation ›